EuroCoinProblem
Import
import numpy as np
import scipy as sp
import matplotlib.pyplot as plt
import seaborn as sns
import empiricaldist
from empiricaldist import Pmf, Distribution
from ipywidgets import interact, interactive, fixed
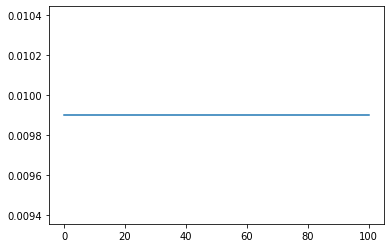
euro = Pmf.from_seq(range(101))
euro
| probs | |
|---|---|
| 0 | 0.009901 |
| 1 | 0.009901 |
| 2 | 0.009901 |
| 3 | 0.009901 |
| 4 | 0.009901 |
| ... | ... |
| 96 | 0.009901 |
| 97 | 0.009901 |
| 98 | 0.009901 |
| 99 | 0.009901 |
| 100 | 0.009901 |
101 rows × 1 columns
Custom Likelihood
def likelihood_euro(data, hypo):
#     print(data, hypo)
    x = hypo/100
    # outcome = data
    if data == 'H':
        return x
    else:
        return 1-x
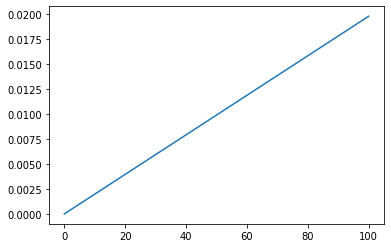
euro = Pmf.from_seq(range(101))
euro.update(likelihood_euro, 'H')
euro.plot()
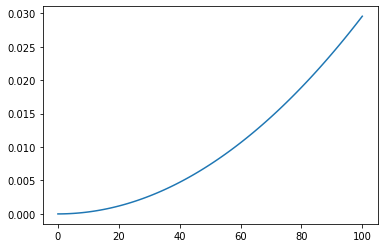
euro.update(likelihood_euro, 'H')
euro.plot()
euro.update(likelihood_euro, 'T')
euro.plot()
euro.update(likelihood_euro, 'H')
euro.plot()
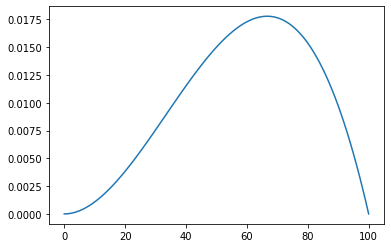
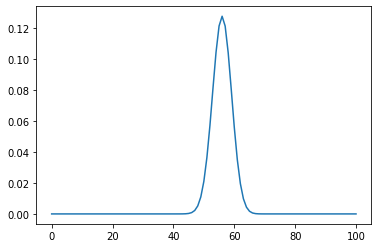
outcome = 'HHHHHHTTT'
euro = Pmf.from_seq(range(101))
for data in outcome:
    euro.update(likelihood_euro, data)

euro.plot()
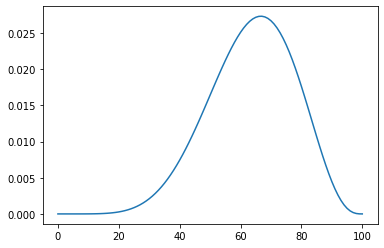
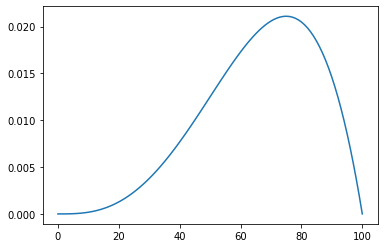
outcome = 'H'*140+'T'*110
euro = Pmf.from_seq(range(101))
for data in outcome:
    euro.update(likelihood_euro, data)

euro.plot()
euro.mean()
55.95238095238095
np.percentile(euro, [10,90])
array([1.62410199e-96, 3.48751559e-02])
#MAP - Maximum aposteori probability
euro.max_prob()
56
euro.quantile(0.5)
array(56.)
euro.credible_interval(0.9)
array([51., 61.])
Note
Assuming prior and credible is true
euro.mean??
np.sum(euro.ps*euro.qs)
55.95238095238095
euro.max_prob??
euro.idxmax()
56
euro.credible_interval??
Effect of Different Priors
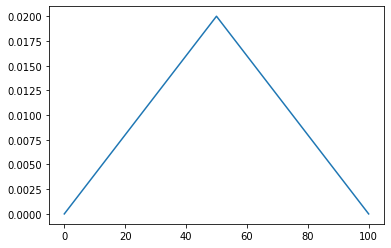
def TriangularPrior():
    """Makes a Suite with a triangular prior
    """

    suite = Pmf(name='triangle')
    for x in range(0,51):
        suite[x] = x
    for x in range(51, 101):
        suite[x] = 100-x
    suite.normalize()
    return suite
euro1 = Pmf.from_seq(range(101), name='uniform')
euro1.plot()
euro2 = TriangularPrior()
euro2.plot()
def decorate_euro(title):
    """Labels the axes.

    title: string
    """
    plt.xlabel('Probability of heads')
    plt.ylabel('PMF')
    plt.title(title)
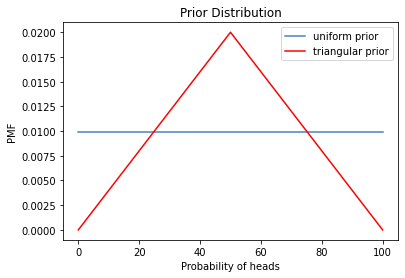
euro1 = Pmf.from_seq(range(101), name='uniform prior')
euro1.plot(color='steelblue')
euro2 = TriangularPrior()
euro2.plot(color='red', label='triangular prior')

plt.legend()
decorate_euro("Prior Distribution")
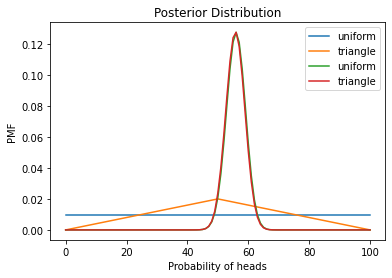
outcome = 'H'*140+'T'*110

euro1 = Pmf.from_seq(range(101), name='uniform')
euro1.plot()
euro2 = TriangularPrior()
euro2.plot()

for data in outcome:
    euro1.update(likelihood_euro, data)
    euro2.update(likelihood_euro, data)
euro1.plot()
euro2.plot()
plt.legend()
decorate_euro("Posterior Distribution")
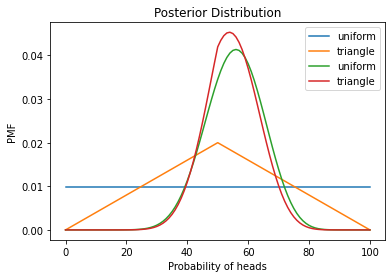
outcome = 'H'*14+'T'*11

euro1 = Pmf.from_seq(range(101), name='uniform')
euro1.plot()
euro2 = TriangularPrior()
euro2.plot()

for data in outcome:
    euro1.update(likelihood_euro, data)
    euro2.update(likelihood_euro, data)
euro1.plot()
euro2.plot()
plt.legend()
decorate_euro("Posterior Distribution")
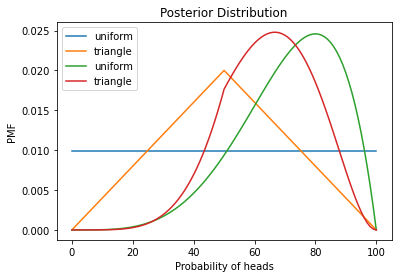
outcome = 'H'*4+'T'*1

euro1 = Pmf.from_seq(range(101), name='uniform')
euro1.plot()
euro2 = TriangularPrior()
euro2.plot()

for data in outcome:
    euro1.update(likelihood_euro, data)
    euro2.update(likelihood_euro, data)
euro1.plot()
euro2.plot()
plt.legend()
decorate_euro("Posterior Distribution")
outcome = 'H'*140+'T'*110

euro1 = Pmf.from_seq(range(101), name='uniform')
euro1.plot()
euro2 = TriangularPrior()
euro2.plot()

for data in outcome:
    euro1.update(likelihood_euro, data)
    euro2.update(likelihood_euro, data)
euro1.plot()
euro2.plot()
plt.legend()
decorate_euro("Posterior Distribution")

euro1.mean() -euro2.mean()
0.20888151378589725

euro1.credible_interval(0.9)
array([51., 61.])
euro2.credible_interval(0.9)
array([51., 61.])
Swammping the priors
More or less agree for posterior
if you start with probability zero , you will always get zero
Avoid assigning probability to zero on everything
Estimated proportions
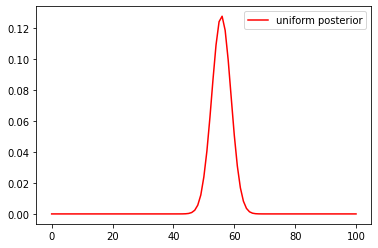
euro2.plot(color='red', label='uniform posterior')
plt.legend()
<matplotlib.legend.Legend at 0x7f98ad26e820>
list(range(51))
[0,
 1,
 2,
 3,
 4,
 5,
 6,
 7,
 8,
 9,
 10,
 11,
 12,
 13,
 14,
 15,
 16,
 17,
 18,
 19,
 20,
 21,
 22,
 23,
 24,
 25,
 26,
 27,
 28,
 29,
 30,
 31,
 32,
 33,
 34,
 35,
 36,
 37,
 38,
 39,
 40,
 41,
 42,
 43,
 44,
 45,
 46,
 47,
 48,
 49,
 50]
Interactive
def likelihood_euro(data, hypo):
#     print(data, hypo)
    x = hypo/100
    # outcome = data
    if data == 'H':
        return x
    else:
        return 1-x
def TriangularPrior(t_peak, n_range):
    """Makes a Suite with a triangular prior
    """

    suite = Pmf(name='triangle')
    for x in range(0, t_peak+1):
        suite[x] = x
    for x in range(t_peak+1, n_range):
        suite[x] = (n_range-1)-x
    suite.normalize()
    return suite
def compare(n_h = 140, n_t=110, t_peak=50, n_range=101):
    outcomes = 'H'*n_h+'T'*n_t

    euro1 = Pmf.from_seq(range(n_range), name='uniform')
    euro2 = TriangularPrior(t_peak, n_range)
    euro1.plot(color='steelblue', label='uniform prior', linestyle='--')
    euro2.plot(color='red', label='triangular prior', linestyle='--')

    for data in outcomes:
        euro1.update(likelihood_euro, data)
        euro2.update(likelihood_euro, data),
    euro1.plot(color='steelblue', label='uniform posterior')
    euro2.plot(color='red', label='triangular posterior')
    plt.legend()
interactive(compare, n_range=fixed(101), t_peak=fixed(50), n_h=(0,140), n_t=(0,140))